


Reduced Cooling Needs Drive Global Energy Demand Growth Down by 1.3% in 2025
The building sector led with 45% of the global energy demand share
April 28, 2026

Follow Mercom India on WhatsApp for exclusive updates on clean energy news and insights
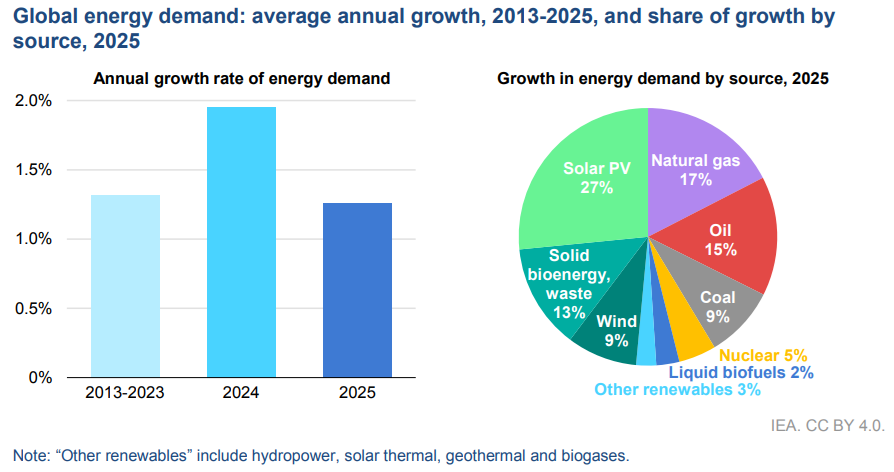
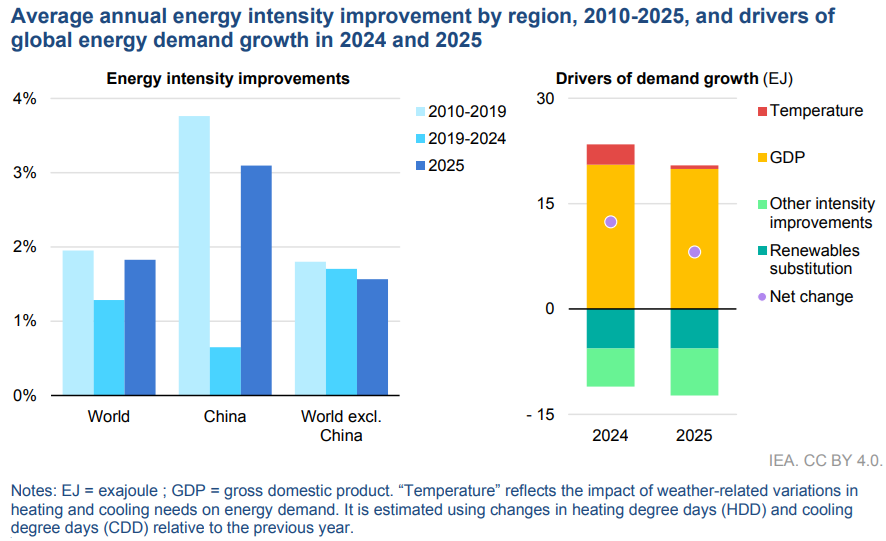
Global energy demand grew by 1.3%, or 8 exajoules (EJ), in 2025, down from a 2% increase in 2024, according to a report by the International Energy Agency (IEA).
This decline in demand was driven by slower global economic growth in 2025 than a year ago, with slower growth in energy-intensive industries in certain regions.
Lower temperatures than in 2024 also resulted in lower cooling demand. Additionally, improvements in energy intensity accelerated over the year.
The increase in solar energy generation met over one-quarter of the global primary energy demand growth. This was the first time on record that modern renewable sources contributed the largest share of global energy demand.
Low-emission sources accounted for approximately 60% of total energy demand growth. This growth occurred despite almost no increase in hydropower output due to poor hydrological conditions in some critical regions.
Global Electricity Demand
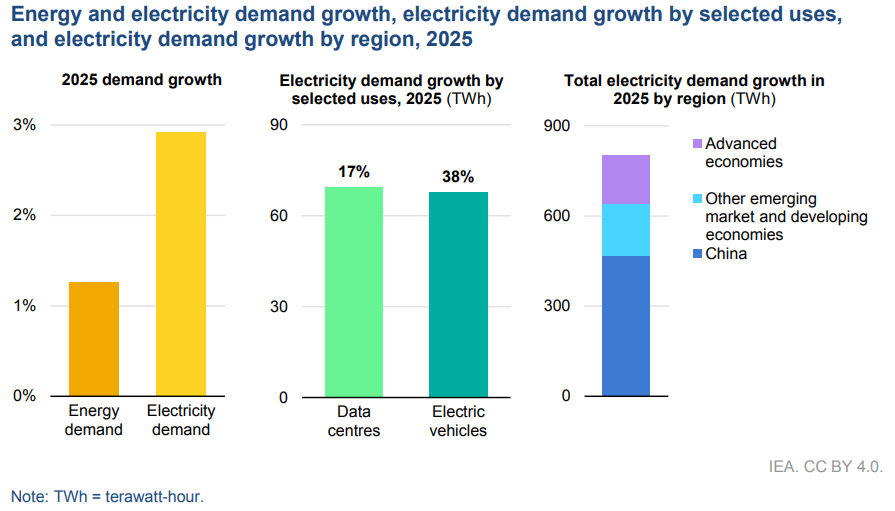
Global electricity demand in 2025 grew by approximately 3% over the 2024 levels, adding roughly 800 TWh. This rate of increase is slower than the growth in 2024.
Demand from electric vehicles (EVs) rose by 38%, and data centers by 17%, respectively. However, demand for such uses accounted for a comparatively smaller share of total energy demand growth.
Industry facilities, household appliances, and commercial buildings other than data centers remained as the primary demand centers.
The global demand growth in 2025 was primarily driven by emerging and developing economies, which contributed approximately 80% of the increase, with China alone accounting for 58%.
IEA had earlier reported that global electricity demand is entering a period of structural acceleration, with consumption projected to grow at an average annual rate of 3.6% between 2026 and 2030.
China’s demand crossed 9,500 TWh, growing 5.1%. India’s demand rose by 1.4% due to a strong monsoon and cooler weather, which reduced cooling needs. Southeast Asia’s demand growth slowed to 3%.
Electricity demand in advanced economies expanded by 1.6% year-over-year (YoY), accounting for 20% of total growth.
In the U.S., which experienced 2% growth, data centers accounted for roughly 50% of total energy demand. The residential, industrial, and transport sectors accounted for the country’s additional demand.
IEA had projected U.S. electricity demand to grow at roughly 2% annually through 2030, with data centers accounting for nearly half of this growth.
An energy demand slowdown in India also affected the global trends. The country’s demand growth stood at approximately 1% in 2025, among the lowest recorded rates in recent years. The reduced demand was driven by an early, heavy monsoon season, which reduced cooling needs, and by the significant expansion of renewable energy sources.
Conversely, demand for natural gas for electricity generation in the European Union (EU) was driven higher by a cold winter and insufficient availability of wind and hydroelectric power. This development occurred even as high gas prices impacted industrial demand.
Energy demand in other regions, except for Africa and the Middle East, was generally lower in 2025 than in the year before.
Electricity Supply
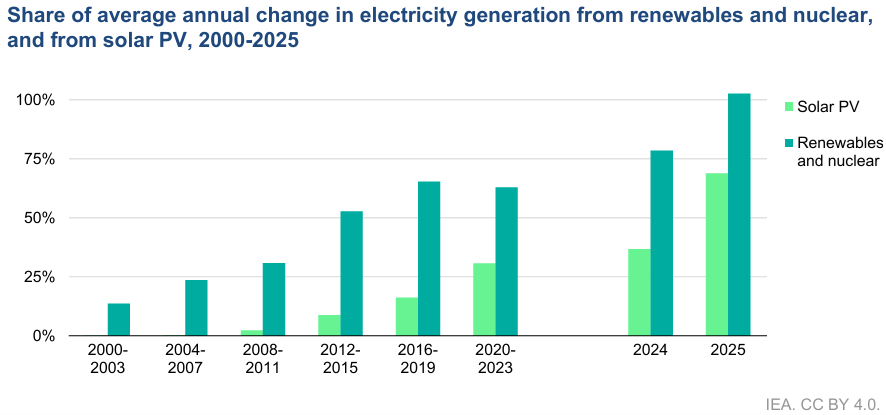
Global electricity generation grew by more than 850 TWh in 2025.
Renewable energy contributed the most to this growth. The combined increase from renewable sources and nuclear power exceeded the total rise in global electricity generation.
Global renewable energy capacity additions grew 16% in 2025, reaching a record total of 800 GW.
China added nearly 500 GW of renewable energy capacity, over 60% of the global total. The EU added approximately 85 GW, approximately 10% higher than in 2024. India’s renewable energy generation grew by nearly 60%, driven by solar and wind.
The U.S. added 49 GW, down 10% YoY due to lower solar installations, despite overall continued deployment growth.
Sub-Saharan Africa and the Middle East and North Africa region each added approximately 12 GW of renewable energy capacity.
Solar installations accounted for more than three-quarters of new capacity, with solar PV capacity additions growing 12% to surpass 600 GW for the first time. Generation from solar PV rose by a record 600 TWh in 2025, bringing its total electricity output to nearly 2,700 TWh.
The increase in solar generation in 2025 was the largest ever observed for any energy source. This excludes years that involve recovery from global economic shocks, such as the COVID-19 pandemic.
Thirty countries installed over 1 GW of solar capacity.
China commissioned around 370 GW of solar capacity. The EU installed 70 GW of solar, with Germany contributing 17 GW and Spain 14 GW.
India added 50 GW of installed capacity.
Solar generation was followed by wind, increasing 8% YoY. Global installed capacity additions increased by nearly 40% YoY to 160 GW.
China installed 117 GW of wind capacity. The EU added 13 GW of onshore and 1 GW of offshore wind capacity.
India’s wind generation exceeded 6 GW.
Solar and wind combined accounted for more than 95% of renewable capacity additions in 2025. Hydropower, bioenergy, geothermal, concentrated solar power, and marine made up the remaining share.
Last November, it reported that global renewable capacity could reach 4,600 GW by 2030. This growth will be driven largely by solar generation.
Energy Intensity
Along with cooler temperatures, energy demand in 2025 was comparatively subdued for multiple other reasons. The global GDP expanded by 3.1%, slower than the 3.3% in 2024. Global temperatures had surged in 2024, driving up energy demand for cooling.
The share of renewable sources in electricity generation increased considerably in 2025, compared with the previous year, enhancing primary energy intensity.
An apparent slowdown in global energy intensity improvements post-COVID has also recently impacted the global energy sector. However, IEA stated that global energy intensity improved by roughly 2% in 2025. This improvement was aligned with the long-term average from 2010 to 2019, a notable acceleration from the recent trend of approximately 1.3% annually from 2019 to 2024.
China’s energy intensity improvements declined significantly from nearly 4% annually between 2010 and 2019 to 0.6% annually between 2019 and 2024. The country’s energy intensity improved in 2025, returning to over 3%.
Energy Demand by Technology
Multiple technologies contributed to the global energy demand in 2025, which increased across all sectors.
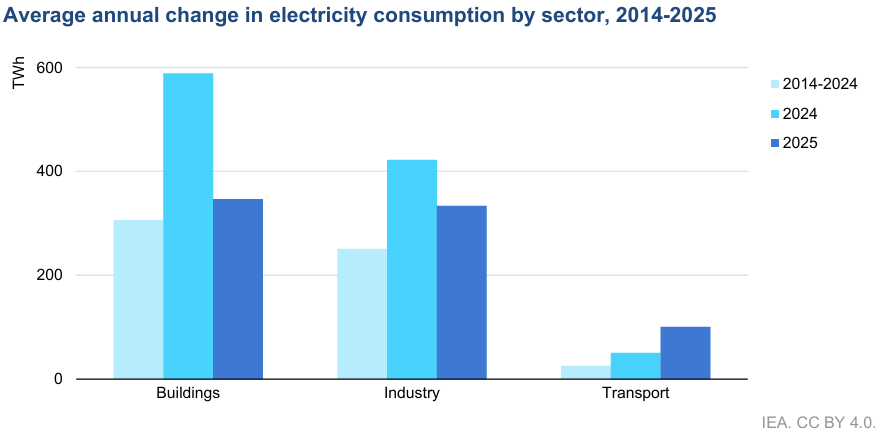
The buildings sector accounted for nearly 45% of electricity demand growth. This was followed by industry demand. The rise in energy demand for these sectors was driven by greater use of appliances such as air conditioners and heat pumps, as well as rising power demand from data centers.
However, regions with milder weather, such as India and Southeast Asia, witnessed reduced cooling needs, with cooling degree days falling by more than 6% YoY. This limited demand, though partially offset globally by higher heating demand, resulted in a net growth of less than 10 TWh.
Notably, electric vehicle (EV) sales worldwide rose more than 20% in 2025 to 21 million. In China, EVs accounted for over 50% of the yearly car sales for the first time. Sales of electric heavy-freight truck sales grew to more than 2,00,000 units, tripling from the figure last year. Plug-in hybrid sales in China grew 4%.
Electric car sales in the EU increased 30%, led by Poland with 140% growth, followed by the UK at over 25% and the Netherlands at 25%. In Norway, battery electric cars reached a record 96% share of all car sales. European electric medium and heavy freight truck sales also rose approximately 40% year-on-year, reaching a 3% market share.
Electric car sales in the U.S. fell 2%. Sales of these vehicles in emerging markets outside China grew roughly 80%. India’s EV sales reached 2.3 million units in 2025, with electric car sales rising more than 75%. Southeast Asia’s electric car sales more than doubled, with sales in Indonesia growing over 125% YoY.
Sales of electric cars in Latin America and the Caribbean rose approximately 70% to nearly 350,000 units. Mexico’s sales more than tripled, Brazil’s 40%, Ecuador’s around 240%, and Uruguay’s roughly 140%.
Global heat pump sales fell approximately 2% in 2025. Sales in China were broadly stable, with reversible air conditioning making up roughly 50% of the market. Europe’s heat pump sales rose 11%, the first year witnessing growth since 2022. Sales in Germany rose 55% in the first half of the year. Heat pump sales in the U.S. fell approximately 13%. However, they outsold gas boilers for the fourth consecutive year. Heat pump sales in Japan remained close to 2024 levels.


Parth Shukla
More articles from Parth Shukla.
